Resource Library
Guides. Briefs. Toolkits. Quick reference information. IDC and its partners created these data quality resources to help states better prepare to address their existing or emerging IDEA data quality needs. Use our search and filtering tools to navigate the library.
Resources 1 - 7 of 30
Format: Applications and Spreadsheets
Nonresponse Bias Analysis ApplicationThe NRBA App is an interactive nonresponse bias application powered by state-of-the-art statistical software. We developed this application to help states examine their SPP/APR Indicator 8 and Indicator 14 data through nonresponse bias analysis. The NRBA App allows users to conduct reproducible analyses of response rates, representativeness, and nonresponse bias, tailored to their survey’s data collection method.
Format: Applications and Spreadsheets
Significant Disproportionality Calculator and User's GuideThe Significant Disproportionality Calculator is a spreadsheet application that the IDEA Data Center (IDC) created to help states analyze their data, make determinations of significant disproportionality, and support local education agencies (LEAs) in their analysis of data for significant disproportionality at the school-level. The accompanying user’s guide describes each worksheet within the calculator, formatting requirements, and instructions for using the calculator.
Format: Toolkits
Preschool Environments ToolkitThe Preschool Environments Toolkit provides materials and resources to help state education agencies (SEAs) and local education agencies (LEAs) collect, report, analyze, and use preschool environments data. State Part B data managers, 619 coordinators, local 619 personnel, technical assistance providers, and other interested parties can use the toolkit to help them report Educational Environments data for children ages 3 through 5 with disabilities enrolled in preschool and receiving services under Part B of IDEA. The toolkit includes materials related to IDEA Section 618 federal reporting requirements and populating Part B SPP/APR Indicator 6, and it offers a Preschool Environments Calculator and Data Analysis Tool to help states calculate and analyze Indicator 6 preschool educational environments data.
Format: Applications and Spreadsheets
Part B Indicator Data Display WizardThe IDC Part B Indicator Data Display Wizard helps state education agency (SEA) staff communicate complex data to stakeholders in a more user-friendly manner. This tool is designed to create data visualizations, in the form of charts, based on State Performance Plan/Annual Performance Report (SPP/APR) data the user enters. IDC has updated the tool to make it easier for users to create visualizations based on the charts’ purposes. Many of the visualizations are dynamic and automatically update based on the data the user enters into the tool. States can easily transfer the visualizations to other programs to meet their reporting needs based on the audience, message, and purpose of the desired report or presentation they are preparing.
Format: Toolkits
SEA Data Processes ToolkitUsing the SEA Data Processes Toolkit to document data processes for all 616 and 618 data collections will establish a well-managed process for data collection, validation, and submission. In collaboration with IDC State Liaisons, states can use the toolkit to create and maintain a culture of high-quality data and establish and support consistent practices that produce valid and reliable data, while building the capacity of state staff.
Format: Applications and Spreadsheets
LEA EDFacts Edit Check and Data Display ToolsThe LEA EDFacts Edit Check and Data Display Tools allow states to identify potential business rule errors or errors in category sets, subtotals, or totals prior to submitting the data to OSEP via the EDFacts Submission System. The tool also provides states with user-friendly data summaries.
Format: Toolkits
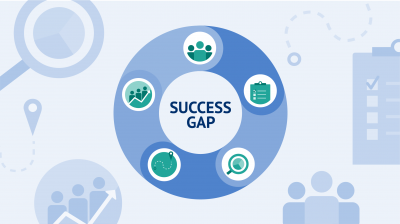
Success Gaps Toolkit: Addressing Equity, Inclusion, and OpportunityThe Success Gaps Toolkit presents a process for using data and the Success Gap Rubric to identify root causes of gaps between groups of children in districts or schools. These success gaps occur when the education system is not meeting the needs of all groups of children and outcomes for some groups are different than outcomes for most groups. The toolkit, with its process and materials, provides a manageable and defined way for districts or schools to identify success gaps that are present and their root causes and then make a plan for addressing the gaps. The success gaps may be the graduation rate of students who are English learners compared to the rate of all other children, the out-of-school suspension rate of children who are Black compared to the rate of all other children, the identification of children who are Hispanic as children with specific learning disabilities compared to the identification of all other children, and other gaps.


