Resource Library
Guides. Briefs. Toolkits. Quick reference information. IDC and its partners created these data quality resources to help states better prepare to address their existing or emerging IDEA data quality needs. Use our search and filtering tools to navigate the library.
Resources 1 - 7 of 7
Format: Quick Reference
SPP/APR Indicator CardThe SPP/APR indicators measure child and family outcomes as well as compliance with the requirements of IDEA. This quick-reference resource from IDC includes a list and brief definition of all the Part B FFY 2020–2025 SPP/APR indicators (including the new Indicator 18!), as well as a list of file specifications associated with each of the seven IDEA 618 data collections, all in one convenient package. Print one out here or contact your IDC State Liaison for a laminated version you can carry along wherever you go.
Format: Guides and Briefs
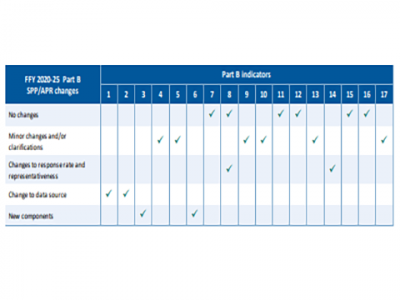
FFY 2020–25 Part B SPP/APR Changes at a GlanceThe FFY 2020–25 Part B SPP/APR Changes at a Glance resource is a quick overview for tracking updates to indicators in the new FFY 2020–25 SPP/APR package. For each of the 17 SPP/APR indicators, the table denotes whether there will be no changes, minor changes and/or clarifications, changes to response rates and representativeness, changes to data sources, and new components.
Format: Guides and Briefs
State Determinations of Local Education Agency (LEA) PerformanceThis resource provides a summary of findings from 28 states’ publicly available LEA determinations processes. States can use this resource to learn more about the data elements, calculation methodologies, and determination category criteria these 28 states used for making LEA determinations. This information can be particularly valuable for those states considering revisions and updates to their own LEA determinations processes.
Format: Toolkits
Preschool Environments ToolkitThe Preschool Environments Toolkit provides materials and resources to help state education agencies (SEAs) and local education agencies (LEAs) collect, report, analyze, and use preschool environments data. State Part B data managers, 619 coordinators, local 619 personnel, technical assistance providers, and other interested parties can use the toolkit to help them report Educational Environments data for children ages 3 through 5 with disabilities enrolled in preschool and receiving services under Part B of IDEA. The toolkit includes materials related to IDEA Section 618 federal reporting requirements and populating Part B SPP/APR Indicator 6, and it offers a Preschool Environments Calculator and Data Analysis Tool to help states calculate and analyze Indicator 6 preschool educational environments data.
Format: Guides and Briefs
Success Gaps Rubric: Addressing Equity, Inclusion, and OpportunityThis rubric allows a team of users from a district or school to systematically examine the root causes of success gaps among groups of students by focusing on equity, inclusion, and opportunity. The recently updated rubric now includes considerations for children as young as preschool age. A complementary white paper provided the research-based background that supported development of the rubric.
Format: Toolkits
Success Gaps Toolkit: Addressing Equity, Inclusion, and OpportunityThe Success Gaps Toolkit presents a process for using data and the Success Gap Rubric to identify root causes of gaps between groups of children in districts or schools. These success gaps occur when the education system is not meeting the needs of all groups of children and outcomes for some groups are different than outcomes for most groups. The toolkit, with its process and materials, provides a manageable and defined way for districts or schools to identify success gaps that are present and their root causes and then make a plan for addressing the gaps. The success gaps may be the graduation rate of students who are English learners compared to the rate of all other children, the out-of-school suspension rate of children who are Black compared to the rate of all other children, the identification of children who are Hispanic as children with specific learning disabilities compared to the identification of all other children, and other gaps.
Format: Guides and Briefs
Examining Representation and Identification: Over, Under, or Both?Significant disproportionality with regard to identifying children as children with disabilities or as children with specific disabilities is, by definition, overrepresentation. This resource defines overrepresentation and three related terms: over-identification, under-identification, and underrepresentation. States can use this resource, in conjunction with the Success Gaps Toolkit to help identify and address the factors contributing to significant disproportionality (i.e., overrepresentation) within school districts.


